
Mapping dependencies and resources for critical operations
In this lesson you will:
- Map the people, technology, information, premises and suppliers behind a critical operation
- Identify single points of failure and hidden dependencies
- Build resource recovery profiles that show what is needed over time
- Keep maps current using existing sources such as the CMDB and contract register
You cannot protect what you cannot see. ISO 22301 requires the BIA to determine the resources and dependencies of prioritised activities. RBI's operational resilience guidance and the Basel principles go further: they expect institutions to map the interconnections behind each critical operation and use the map to find vulnerabilities and test against tolerance.
1. What a map contains
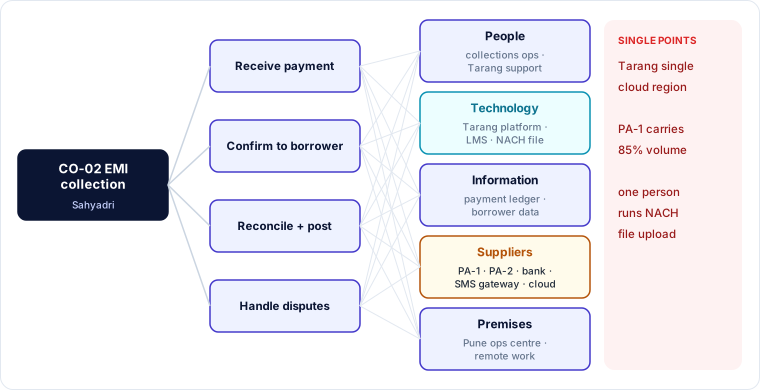
A map links three layers:
- The critical operation, such as EMI collection and posting.
- The activities that deliver it: receive payment, confirm to borrower, reconcile and post, handle disputes.
- The resources each activity needs, in five families:
| Resource family | Examples | Questions to ask |
|---|---|---|
| People | Collections operations, IT on-call, a single person who uploads NACH files | Minimum number? Specific skills? Who else can do it? |
| Technology | Applications, infrastructure, networks, end-user devices, identity provider | Which systems? Where hosted? What do they depend on (DNS, certificates, SSO)? |
| Information | Payment ledger, borrower data, bank files, vital records | Where stored? Backed up? RPO? |
| Premises | Operations centre, branches, data centres | Alternatives? Remote work possible? |
| Suppliers and partners | TSPs, payment aggregators, banks, telecom, cloud | Their RTO and RPO for our service? Substitutes? Their suppliers? |
2. Building the map
Mapping is detective work. Combine:
- BIA interviews, which reveal workarounds and unofficial dependencies ("we email the file to Ravi, who uploads it");
- the CMDB or asset inventory from the ISMS, giving systems, hosting and owners;
- architecture diagrams and data flows, including identity, DNS, certificates, monitoring and secrets management, all of which are easy to forget;
- the contract and outsourcing register, giving suppliers, services and SLAs;
- incident history, since past outages reveal dependencies that diagrams miss.
Start from the customer journey and walk it end to end. For each step ask, "What has to work for this step to work?" Keep asking until you reach something outside your control or something already mapped.
3. Finding weak points
Once mapped, look for:
- Single points of failure (SPOFs): a resource with no alternative whose loss breaks the operation within tolerance, for example one cloud region, one person, one aggregator carrying most traffic or one network link.
- Shared dependencies: several critical operations depending on the same resource, such as an identity provider whose failure would stop everything at once.
- Hidden dependencies: a service that seems redundant but shares a component, for example two aggregators using the same bank, or a DR site using the same SSO as production.
- Concentration: many institutions depending on the same provider (Lesson 3.5).
- Mismatched objectives: a supporting resource whose RTO or RPO is longer than the activity it supports needs.
Each weak point becomes an input to the risk assessment (Lesson 3.4) and to strategy (Module 4).
4. Resource recovery profiles
The BIA must determine the resources needed to resume prioritised activities. A recovery profile shows what is needed over time, not just at normal levels.
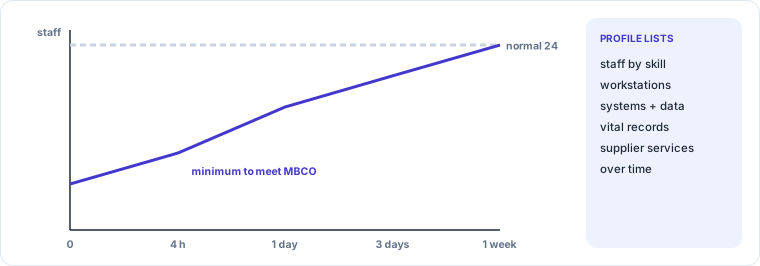
| Resource | Within 4 h | Within 24 h | Within 1 week |
|---|---|---|---|
| Collections staff | 6 (to meet MBCO) | 16 | 24 (normal) |
| Workstations or laptops | 6, remote-capable | 16 | 24 |
| Systems | Payment links, confirmation SMS | + reconciliation, posting | + reports, analytics |
| Vital records | Borrower contact list, payment ledger | + bank statements | all |
| Supplier services | One aggregator, SMS gateway | + NACH upload via sponsor bank | all |
Profiles drive strategy decisions. For example, if only six people are needed in the first four hours, a small remote-working team may be a better strategy than a fully equipped alternate office.
5. Keeping maps alive
Maps decay fast in organisations that change architecture monthly. To keep them current:
- link maps to the CMDB and update them through change management: any change touching a mapped resource triggers review;
- review maps at least annually with BIA updates, and after any incident that revealed an unmapped dependency;
- store maps in a form that can be queried ("what depends on the identity provider?"), not only as diagrams.
Auditor lens
Auditors and inspectors pick a critical operation and ask for its map, then test it. "Which identity provider does the DR environment use?" "Who uploads the NACH file if Ravi is on leave?" A map that cannot answer these questions is incomplete. A map that was last updated before a major migration is out of date.
Case study — Sahyadri and Tarang: mapping collections
Sahyadri and Tarang map collections together in a joint workshop. Findings:
| Finding | Type | Action |
|---|---|---|
| Tarang runs in one cloud region | SPOF (technology, supplier) | Input to Tarang's DR strategy (Module 4) |
| Aggregator PA-1 carries 85% of payment-link volume; PA-2 is configured but rarely used | Near-SPOF (supplier) | Routing switch tested; volume split target 60/40 |
| One Sahyadri employee uploads NACH files to the sponsor bank | SPOF (people) | Second person trained; procedure written |
| Tarang's DR environment (planned) would use the same identity provider tenant as production | Hidden dependency | Break-glass accounts and a separate admin path designed |
| SMS confirmation via a single gateway | Dependency within MBCO | Second gateway via WhatsApp business provider |
The joint map becomes a shared document. Each party owns its part, and both review it after any change to the collections flow.
Key takeaways
- Map each critical operation to activities and to people, technology, information, premises and suppliers.
- Build maps from interviews, CMDB, architecture, contract registers and incident history, walking the customer journey.
- Look for SPOFs, shared, hidden and concentrated dependencies, and mismatched objectives.
- Recovery profiles show resources needed over time and often justify cheaper strategies.
- Keep maps alive through change management and periodic review.
Self-check
- Name the five resource families in a dependency map.
- Give an example of a hidden dependency in a DR design.
- How can a recovery profile change the choice of workplace strategy?