
Monitoring, measurement and resilience metrics (9.1)
In this lesson you will:
- Explain what ISO 22301 clause 9.1 requires
- Choose leading and lagging resilience metrics that reflect capability and outcomes
- Build a resilience dashboard for management and the board
- Avoid metrics that look good but say little about resilience
"Are we resilient?" is a question boards ask and BCM managers struggle to answer. Activity counts such as "12 plans updated, 4 exercises held" are easy to report but say little. Clause 9.1 asks the organisation to decide what to measure so that it can evaluate BC performance and effectiveness honestly.
1. What ISO 22301 requires
The organisation must determine:
- what needs to be monitored and measured;
- the methods for monitoring, measurement, analysis and evaluation, as applicable, to ensure valid results;
- when and by whom monitoring and measuring are performed;
- when and by whom results are analysed and evaluated.
It must retain documented information as evidence of the results, and evaluate the BC performance and the effectiveness of the BCMS.
2. Leading and lagging indicators
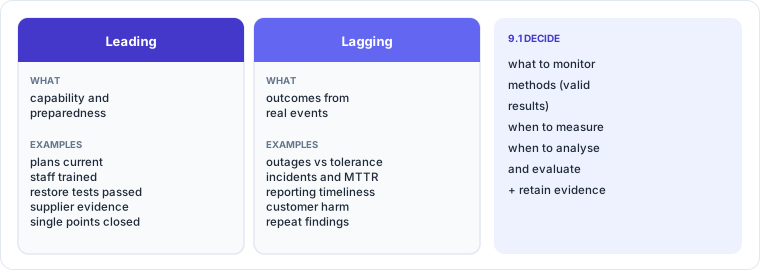
| Type | Measures | Examples |
|---|---|---|
| Leading (capability, preparedness) | Whether the organisation is ready | Critical operations with approved tolerances and current maps; plans reviewed in 12 months; recovery staff trained and exercised; restore tests passed; critical suppliers with DR evidence; single points of failure closed |
| Lagging (outcomes) | What happened in real events and tests | Disruptions and their duration versus tolerance; RTO achieved in drills; incident MTTR; reporting deadlines met; customer harm; repeat findings |
You need both. Leading indicators let you act before something goes wrong. Lagging indicators show whether the preparation worked.
3. Metrics that matter
Good resilience metrics are tied to tolerances and objectives, evidence-based and comparable over time. A practical core set:
| Metric | Why it matters |
|---|---|
| Critical operations shown to stay within tolerance in scenario tests | The central operational resilience question |
| RTO and RPO achieved in the last drill for each Tier 1 service | Demonstrated, not documented, capability |
| Ransomware recovery time (tested) | The scenario most likely to breach tolerance |
| Exercise and audit actions closed on time | Whether learning turns into change |
| Critical suppliers with current DR evidence | Third-party resilience |
| Plans and BIA current (reviewed in period and after changes) | Documentation fitness |
| Regulatory and customer notifications on time | Compliance with the reporting clock |
| Real disruptions: number, duration, tolerance breaches | Outcomes |
Express metrics with targets and trend, and make sure each red or amber item has an action, owner and date.
4. Valid results
Clause 9.1 stresses valid results. Common validity problems:
- Self-reported status with no evidence ("plan reviewed: yes"). Link each metric to a record.
- Inconsistent definitions: one team measures RTO from declaration, another from incident start. Define each metric once.
- Gaming: tests designed to pass (Lesson 7.3). Measure under realistic conditions.
- Averages hiding problems: a 98% average plan currency can conceal the one critical plan that is two years old. Report critical items individually.
5. The resilience dashboard
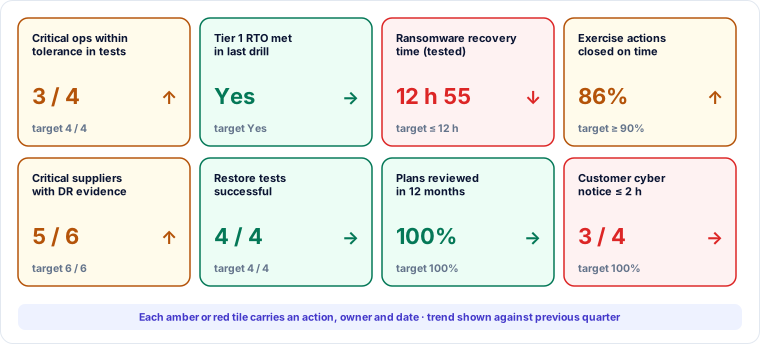
A dashboard for management and the board should fit on one page, use the same metrics every period, show status against target and trend, and highlight decisions needed. Detailed metrics stay with the steering group; the board sees the critical few.
Who measures and evaluates? Typically the BCM manager compiles, metric owners provide data with evidence, the steering group evaluates monthly, and management review and the board evaluate quarterly or annually.
Auditor lens
Auditors check that the organisation has decided what to measure (a defined metric set with methods and responsibilities), that results are retained, and that they are evaluated in management review. They test validity by tracing a reported number back to its source record. A metric reported as green with no evidence behind it is a finding.
Case study — Tarang Ledger: the year-1 dashboard
At month 11, Anil presents the dashboard in Figure 8.2 to the steering group:
- Critical operations within tolerance in tests: 3 of 4. The fourth, collections under ransomware, depends on customers' workaround while clean recovery takes 12 h 55 min.
- Ransomware recovery time: 12 h 55 min against ≤ 12 h. Action: incremental reconciliation, due month 14.
- Customer cyber notice ≤ 2 h: 3 of 4 events. One real SEV-2 took 2 h 20 min; root cause analysis in Lesson 8.4.
- Critical suppliers with DR evidence: 5 of 6. PA-1's report is outstanding; contract amendment in progress.
Each amber or red tile has an owner and date. The board's audit and risk committee receives the same page quarterly with a short narrative.
Key takeaways
- 9.1: decide what, methods (valid results), when and who for measurement and evaluation; retain evidence; evaluate performance and effectiveness.
- Use leading (capability) and lagging (outcome) indicators.
- Core metrics: tolerance in tests, RTO/RPO achieved, ransomware recovery time, actions closed, supplier evidence, documentation currency, notification timeliness, real disruptions.
- Protect validity: evidence-linked, consistent definitions, realistic tests, critical items shown individually.
- A one-page dashboard with targets, trend and decisions needed.
Self-check
- Give two leading and two lagging resilience indicators.
- Why must RTO measurement definitions be consistent across teams?
- What makes a reported metric "valid" under clause 9.1?