
Limits and performance: hallucination, drift, collapse, evaluation and oversight
In this lesson you will:
- Explain hallucination, non-determinism and uncertainty and how to manage them
- Distinguish data drift, concept drift, model drift and behavioural drift
- Describe model collapse and its causes
- Select appropriate evaluation metrics for classifiers and generative models
- Compare human-in-the-loop, human-on-the-loop and fully automated operation
Not every AI failure is an attack. Many incidents come from the model simply being wrong, inconsistent or out of date. Security and risk professionals need to tell the difference, measure it, and decide how much human oversight a use case needs.
1. Reliability limitations
Hallucination
A hallucination (sometimes called confabulation) is fluent, confident output that is false or unsupported — an invented citation, a non-existent API, a wrong figure. It happens because language models generate plausible continuations, not verified facts.
Mitigations:
- Ground answers in retrieved sources (RAG) and require citations.
- Constrain outputs to structured formats and validate them.
- Lower temperature for factual tasks.
- Use verification steps: a second check, a rules engine, or a human reviewer for high-impact answers.
- Communicate limitations to users; avoid presenting AI output as authoritative.
Hallucination becomes a security issue when it drives action — for example, a coding assistant suggesting a package name that does not exist, which an attacker then registers (package hallucination or "slopsquatting").
Non-determinism
The same input can produce different outputs because of sampling (temperature, top-p), parallel computation on accelerators, and silent model updates by the provider.
Consequences: hard to reproduce bugs or attacks, unstable test results, and audit difficulty. Mitigations: fix sampling parameters, pin model versions, log full inputs and outputs, and test with repeated runs rather than single samples.
Uncertainty
Models often express high confidence regardless of correctness — they are poorly calibrated. Two kinds of uncertainty:
- Aleatoric — inherent noise in the data; more data will not remove it.
- Epistemic — the model lacks knowledge, for example on inputs unlike its training data; more relevant data can reduce it.
Mitigations: confidence thresholds with fallback to a human, abstention ("I don't know") behaviour, and out-of-distribution detection.
2. Lifecycle degradation: drift
A model that performed well at launch can degrade silently as the world changes.
| Type | What changes | Example |
|---|---|---|
| Data drift (covariate shift) | Distribution of inputs | New payment channel changes transaction patterns |
| Concept drift | Relationship between input and correct output | Fraudsters adopt a new technique; old signals stop working |
| Model drift | Overall model performance decays (result of the above) | Detection rate falls month on month |
| Behavioural drift | A model or agent's behaviour changes, often after an update | Provider updates a hosted LLM; tone, refusals or tool use change |
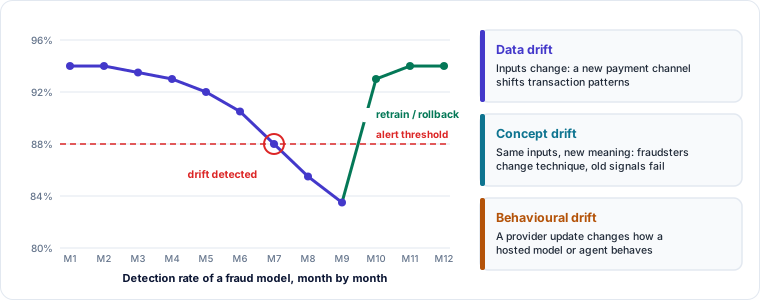
Detection: monitor input statistics, output distributions, accuracy against fresh labelled samples, and behavioural test suites run on a schedule and after every update. Response: retraining, recalibration, rollback, or tightening oversight.
Security lens: drift can be induced. An adversary can gradually feed data that moves a model's notion of normal. Drift monitoring is therefore also a detection control. Significant drift should be a reassessment trigger in your risk process.
3. Model collapse
Model collapse is the degradation that occurs when models are trained repeatedly on data generated by other models (or themselves). Each generation loses information about rare cases — the tails of the distribution — so outputs become blander, less diverse and increasingly wrong.
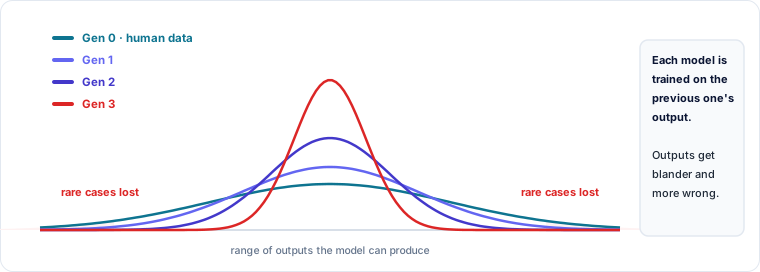
Why it matters now: a growing share of web content is AI-generated, and that content feeds future training sets.
Mitigations: track data provenance (human vs synthetic), retain and prioritise trusted human-generated data, cap the share of synthetic data, and validate synthetic data quality before use.
4. Evaluation metrics and benchmarks
Classification metrics
Built on the confusion matrix: true positives (TP), false positives (FP), true negatives (TN), false negatives (FN).
| Metric | Formula | Answers |
|---|---|---|
| Accuracy | (TP+TN) / all | How often is it right overall? Misleading on imbalanced data |
| Precision | TP / (TP+FP) | Of the alerts raised, how many were real? |
| Recall (sensitivity, TPR) | TP / (TP+FN) | Of the real cases, how many did we catch? |
| F1 score | Harmonic mean of precision and recall | Balance of the two |
| False positive rate | FP / (FP+TN) | How often do we wrongly flag benign cases? |
| ROC-AUC | Area under the TPR-vs-FPR curve | Ranking quality across thresholds |
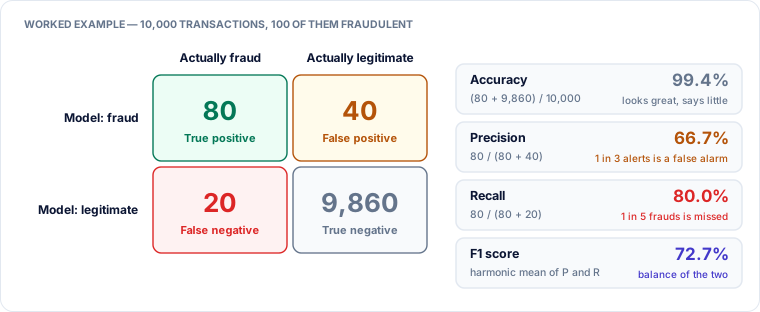
Example: in fraud detection where 1 in 1,000 transactions is fraudulent, a model that labels everything "legitimate" scores 99.9% accuracy and catches nothing. Use precision, recall and cost-weighted metrics instead.
Worked example — moving the alert threshold
Using Figure 1.20's fraud model, the team lowers the alert threshold so the model flags more transactions. It now flags 300 transactions, 95 of them fraudulent.
| Before | After | |
|---|---|---|
| True positives | 80 | 95 |
| False positives | 40 | 205 |
| False negatives | 20 | 5 |
| Precision | 66.7% | 95 / 300 = 31.7% |
| Recall | 80.0% | 95 / 100 = 95.0% |
| Alerts to review | 120 | 300 |
Recall improves sharply, but analysts now review two and a half times as many alerts, and two in three are false alarms. Neither setting is "correct": the right threshold depends on what a missed fraud costs compared with an analyst's time and a wrongly blocked customer. Write that trade-off down — it is a risk decision, and it belongs to the business owner, not only the data science team.
Choosing what to optimise: if missing an attack is costly (malware detection), favour recall; if false alarms are costly (blocking customer payments), favour precision.
Generative and language-model evaluation
- Perplexity — how well a model predicts text; lower is better; mainly a training diagnostic.
- Overlap metrics such as BLEU and ROUGE — compare output with reference text for translation and summarisation; weak at judging meaning.
- Benchmarks — standardised test sets for knowledge, reasoning, coding and safety.
- Human evaluation and model-graded evaluation ("LLM-as-judge") — for open-ended quality; the judge itself must be validated.
- Task-specific metrics — groundedness/faithfulness for RAG, tool-call success rate for agents, refusal rate and jailbreak resistance for safety.
Benchmark caveats: contamination (test data leaked into training), saturation (top models all score near the ceiling), and poor transfer to your own use case. Always build an evaluation set from your own domain.
Operational metrics
Latency, throughput, cost per request, token usage, error and refusal rates, and human-override rate.
5. Operational modes and human oversight
| Mode | How it works | Suits |
|---|---|---|
| Human-in-the-loop (HITL) | A human must approve before the AI's output takes effect | High-impact or irreversible decisions: credit refusal, account closure, production changes |
| Human-on-the-loop (HOTL) | AI acts autonomously; a human monitors and can intervene or override | High-volume, time-sensitive tasks with moderate impact |
| Human-out-of-the-loop / automated execution | AI acts with no real-time human involvement | Low-risk, reversible, well-tested tasks |
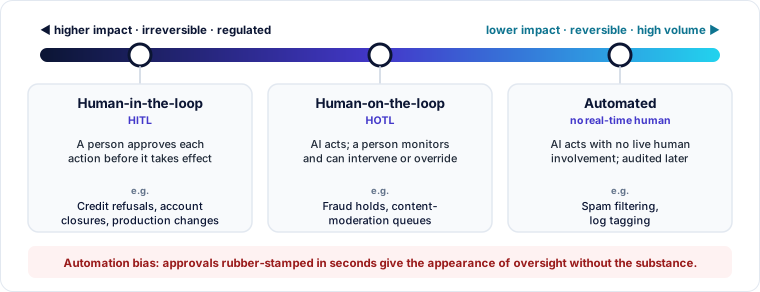
Choosing the mode depends on impact, reversibility, volume, speed, model reliability and regulatory requirements. Many regulations expect meaningful human oversight for high-risk uses.
Watch for automation bias — humans rubber-stamping AI output. Make oversight meaningful: show confidence and sources, sample-audit approvals, and track how often reviewers override.
🔐 Security lens
When something goes wrong, ask first: is this a model limitation or a security vulnerability? A hallucinated answer is a reliability defect; an answer produced because an attacker injected instructions is a security incident. The distinction drives triage, ownership and response.
Key takeaways
- Hallucination, non-determinism and poor calibration are inherent; manage them with grounding, validation, pinned versions and oversight.
- Data, concept, model and behavioural drift degrade systems over time — and drift can be adversarially induced.
- Model collapse comes from training on AI-generated data; provenance tracking is the defence.
- Accuracy misleads on imbalanced data; choose precision, recall or F1 according to the cost of each error type.
- Match HITL, HOTL or automation to impact and reversibility, and guard against automation bias.
Self-check
- A malware classifier has 99% accuracy on a dataset where 1% of files are malicious. Why is that not reassuring?
- Your hosted LLM provider pushes a silent update and your agent starts calling tools differently. What type of drift is this, and what should happen in your risk process?
- When would you choose human-on-the-loop over human-in-the-loop?